
Not many people would turn down the chance of market-beating returns in their portfolio, but it takes a lot of analysis to judge whether an investment will help you reach your targeted return. A measure often used to help people value an investment is alpha, but how is it calculated and what does it show?
What is alpha?
The first thing to understand is that alpha is a vague concept – as is often the case when evaluating the performance of a fund or strategy.
Broadly speaking, alpha reflects the ‘active’ return of an investment against a benchmark. Active management is a strategy where a fund manager tries to outperform the wider market or the benchmark it closely correlates with.
For example, imagine Fund A returns 5% over 12 months, outperforming the 4% growth on the benchmark. In this instance, you would describe alpha as 1%.
In reality, it’s more difficult to analyse the performance and authenticity of active return.
To generate alpha, a fund manager needs to have faith in their ability to time the market to buy and sell investments at their most profitable time, and select the single securities they believe will outperform the market.
Alpha and financial theory
The use of alpha as a statistical measure derives from:
- Modern Portfolio Theory (MPT), which outlines the relationship between risk and return
- Capital Asset Pricing Model (CAPM), which first introduced the concepts of Alpha and Beta
Pioneered by Harry Markowitz, MPT suggests there’s an ‘efficient frontier’ of portfolios that offer the maximum expected return for a given level of risk.
When thinking about risk and how best to manage it in your portfolio, it’s useful to decide whether it can be described as systematic – also known as market or un-diversifiable risk – or unsystematic – also known as specific risk, which can be managed better through diversification.
How can you measure alpha?
A fund manager decides how much risk to take, which is represented by the beta. A beta of 1 means taking on as much risk as the broader market, and the same returns should be expected. A beta of below 1 means taking on less risk than the general market.
A beta that’s higher than 1 means the fund manager is taking on more risk and thus should expect greater returns. It’s important to separate whether any active returns above the market represents the extra risk that was taken or the fund manager’s skill.
Essentially, if a portfolio’s returns can be explained by the markets, alpha should be 0.
Jensen’s alpha
Alpha is usually stated in a single number, which reflects how well an investment has performed compared to its benchmark. The basic alpha calculation simply subtracts the total return of your investment from the return of the benchmark.
There’s a more advanced technique called Jensen’s alpha that includes Capital Assets Pricing Model (CAPM) theory, and calculates the risk free rate and beta.
Outlining the relationship between risk and return, CAPM is used to price risky assets, estimating the expected return for a given level of risk. In line with CAPM, to calculate Jensen’s alpha in a portfolio you need to know:
- R(i) – realised average return of the portfolios
- R(m) – the realised return of the benchmark
- R(f) – the risk-free rate of return
- B – the portfolio’s beta
You’ll plug these numbers into the following equation to calculate the alpha:
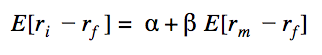
Excluding any market impact, alpha will be zero – if CAPM is correct.
If the alpha isn’t a positive figure, the fund manager wouldn’t have earned enough return for the amount of risk she was taking. A positive outcome means the portfolio is earning excess returns compared to its benchmark in an uncorrelated way.
The difference between Jensen alpha and standard alpha is that the former allows to evaluate the consistency of the excess return.
For example, assume you’ve invested in two funds; Fund A and Fund B. Both funds have the same level of standard alpha in the last year but performed quite differently.
Fund A performed below its benchmark for the entire year except for one day, where the performance was so strong it pulled the overall alpha of the year to positive. Fund B had a positive and systematic excess return over the benchmark each day of the year.
Understanding the risk/return relationship, which fund would you be more comfortable investing in?
In this example, Fund B would have had a more statistically significant alpha performance than Fund A, and perhaps a more reliable investment.
What are the problems with alpha?
As with any theory, alpha is by no means infallible.
It can be quite difficult to find a comparable benchmark to assess the performance of your portfolio. But you need to chose this wisely to get a true reflection of the value active management has brought to your portfolio.
When there’s no suitable benchmark, analysts can now use algorithms and other models to simulate an index just for the purpose of calculating alpha.
Alpha versus efficient market hypothesis
Those who question the validity of alpha, may fall into the efficient market hypothesis (EMH) camp, and believe that any risk adjusted excess return is generated by luck rather than skill.
EMH suggests the market has already priced in all available information, so is accurately valued. This would mean active managers don’t necessarily have an elusive edge over anybody else.
No matter whether you think generating market-beating returns comes down to skill or luck, we do know it’s near-on impossible to beat the market every year, and some active funds have been struggling. Two-thirds of large-cap active fund managers failed to beat the S&P 500 in 2016, according to the S&P Dow Jones Indices.
Smaller asset managers had a tough time too, with 90% of mid-cap and 86% small-cap managers missing the mark.
Under scrutiny by investors and the industry alike, active managers got some of their mojo back in 2017, with just over half of equity funds outperforming their benchmark in 2017, up from 23% in 2016, according to research firm Scope Analysis.
At Moneyfarm, we have nothing against active investments, but we do have a problem with the fees investors are often required to pay for active management. Overly expensive fees can damage performance and delay investors from reaching their goals.
The more money you can keep invested in the market, the better, as you can maximise your returns through compound interest. This is where your returns are reinvested to earn their own returns, and can make a real difference over the long-run.
It’s crucial investors understand how fees impact performance. Whilst you can never guarantee a return from your investments, you can control how much you pay in fees.
Active decision-making
Of course, when it comes to passive investments, if the benchmark a fund is tracking falls in value, so will the fund. This means it’s doing its job correctly.
That’s why Moneyfarm builds investment portfolios that are diversified across asset classes and geographies to manage this risk. Diversification looks to offset any losses in your portfolio with gains made elsewhere.
You might want to invest in passive instruments to maximise your returns by reducing costs, but you can include an active decision-making strategy to build your portfolio in the best way to reflect your investor profile.
Our team of Investment Consultants can assess the impact fees are having on your portfolio, just book a call for a portfolio review.
The post What is alpha? appeared first on MoneyFarm Decodes.