
For anyone looking to invest their money in an ISA, the decision between whether to allocate their funds in a cash ISA or a stocks and shares ISA is a vital one. Depending on the circumstances, both have their merits as the ISA deadline approaches. It pays, then, to be as informed as possible when planning for your own secure financial future.
There is also a decision to be made regarding the type of stocks to invest in. Moneyfarm’s research team simulated the performance of four different hypothetical investment portfolios over the decade from 2010 to 2020. Namely: cash ISAs, FTSE 100 portfolios, global equity investments, and a balanced portfolio between equity investments and global bonds.
Of course, the financial context of the decade is important to bear in mind when analysing the results. That said, there is a disparity between the returns and the relative volatility of the different asset classes studied. For investors, it is a case of weighing up the level of risk you are comfortable exposing yourself to and projecting accordingly. It is also a matter of detailing just how long term your strategy is – those with broader time horizons can take on greater risk and give themselves a far better chance of reaping the benefits.
Want to invest in an ISA? Moneyfarm’s investment advisors are on hand to help you choose the right portfolio for your risk level and financial goals. Get in touch today.
Before we dive into our simulation, it is important to note that it is just that. Also, note that past performance is not necessarily a reliable indicator of future returns. We do, however, expect the underlying characteristics of the last 10 years – low interest rates, expansionary monetary policy, and controlled inflation in the US – to continue for the foreseeable future.
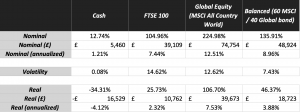
Based on data from Bloomberg and the Bank of England
Cash ISAs
Cash ISAs are, ultimately, predictable. Very low rates of volatility – in the extremely stable region of 0.08%, according to our study – mean that returns are fairly easy to calculate. These ISAs have, traditionally, been viewed (rightfully) as a safe deposit box in which to grow savings moderately over time and, at the very least, protect them from inflation.
In terms of our simulation, we used figures from the Bank of England to calculate the returns for cash ISAs.
The problem comes when real returns are considered in periods of moderate inflation and low interest. This environment means that the real value of savings decreases over time, so investments need to be working well and seeing returns to ensure the pot grows in the long-term.
The last 10 years
The global economy closed the decade in a much healthier position than it did entering it. 2019 was a positive ending to a decade in which global equity markets more than doubled in value. The decade was marred by political upheaval across the globe, events that the world economy managed to escape relatively unscathed from.
This is not to say that economies everywhere have seen plain sailing across the 10 year period. For the UK in particular, it was a decade defined by uncertainty. Britain’s withdrawal process from the European Union injected instability into the markets after years of continued recovery from the 2008 financial crisis.
In terms of what this all means for cash, the last decade has been defined by loose monetary policy from central banks and high rates of inflation. Global interest rates are also, currently, notably low – the Bank of England, for example, has stuck with its 0.75% rate and is reportedly considering lowering that further to stimulate the economy. This has resulted in is the traditionally safe, predictable investment of a cash ISA performing relatively poorly over the course of the decade.
If the maximum amount of investment was made each year from 2010 up to and including 2019, in a portflio made up of cash ISAs, a total of £110,920 would have been saved tax-free in the decade. As you can see from the table detailing our study, this means a real return of -34.41%, or -4.12% each year. With the maximum amount invested each year, cash would have generated a loss of over £16,000 across the decade.
Stocks and shares ISAs
By contrast, let’s examine the performance of various forms of stocks and shares portfolios over the same period. For the purposes of the research, we looked at a FTSE 100-only profile, a global equities profile, and a balanced profile split 60/40 between equities and bonds.
The first thing to note is that all performed well. On average, the hypothetical stocks and shares ISAs we simulated saw nominal annual gross revenues of 9.64%. Up against the nominal annual return of the cash ISA – 1.21% – the benefits of opening an investment up to greater risk over an extended period of time come into sharper focus.
The difference between the different spreads becomes apparent when we examine their relative returns. Over the 10 years, the FTSE 100 portfolio saw the lowest nominal returns – a serviceable 104.96%. At the other end of the scale, the global equities portfolio saw impressive nominal returns of 224.94%. In this context, cash’s 12.74% pales into insignificance.
Why diversification is important
Ultimately, it is a balanced approach that we believe offers the best risk-return profile. Investing in global equities between 2010 and 2020 would have provided the greatest real return – £39,673 – but this asset class comes with relatively high volatility. 12.62% over the course of a decade is manageable, but there is no guarantee that returns would be so positive over the same period going forward.
The FTSE 100 portfolio saw the greatest volatility of the three – at 14.62% – which makes its relatively modest return all the more disappointing. Our view is not necessarily that the FTSE 100 will continue underperforming, rather than a diversified portfolio has a better chance of lower volatility and to be less affected by local risks like Brexit.
By spreading investments across a balanced portfolio, the volatility drops to a far more palatable 7.43%. A nominal return of £48,924 translates to a real return of £18,723 – clear protection against inflation and an effective way to make your investments work for you without taking on an off-putting degree of risk.
Our strategy at Moneyfarm is to combine the right mix of assets with the appropriate level of risk for each individual customer. We update our portfolios regularly to ensure that our customers are always getting the most out of their investments. This is all backed by low fees and personal, dedicated investment advice.
The post Cash ISA vs Stocks and Shares ISA: A 10-year study appeared first on MoneyFarm Insights.